No Code. No Mannual Monitoring. No Missed Events
The Agentic AI Energy Management Platform
EDI is Edgecom’s Agentic AI Energy Management platform. It connects live energy data, grid events, and asset controls to automated actions.
< 0 s
Data Granularity
0 /7
NOC Monitoring
0 /7
Stackable Program Priorities
0 %
ISO 27001/NIST 800-53 Compliant
Why EDI is Different
One Platform. Every Energy Event Covered.
EDI (Energy Data Intelligence) is the workflow automation engine built into the Edgecom Energy Customer Portal. It lets energy managers, asset operators, and program administrators design automated workflows that connect any data event in the platform to any action, without writing code and without leaving the platform they already use.
Energy-Native by Design
EDI was not adapted from a generic automation tool. It was built for energy events, energy data, and energy actions from the ground up. The trigger logic speaks your market natively.
Live Data
IoT sensor data, demand response status, peak probability, and baselines are key inputs in workflows. No API setup. No third-party connector. No middleware layer.
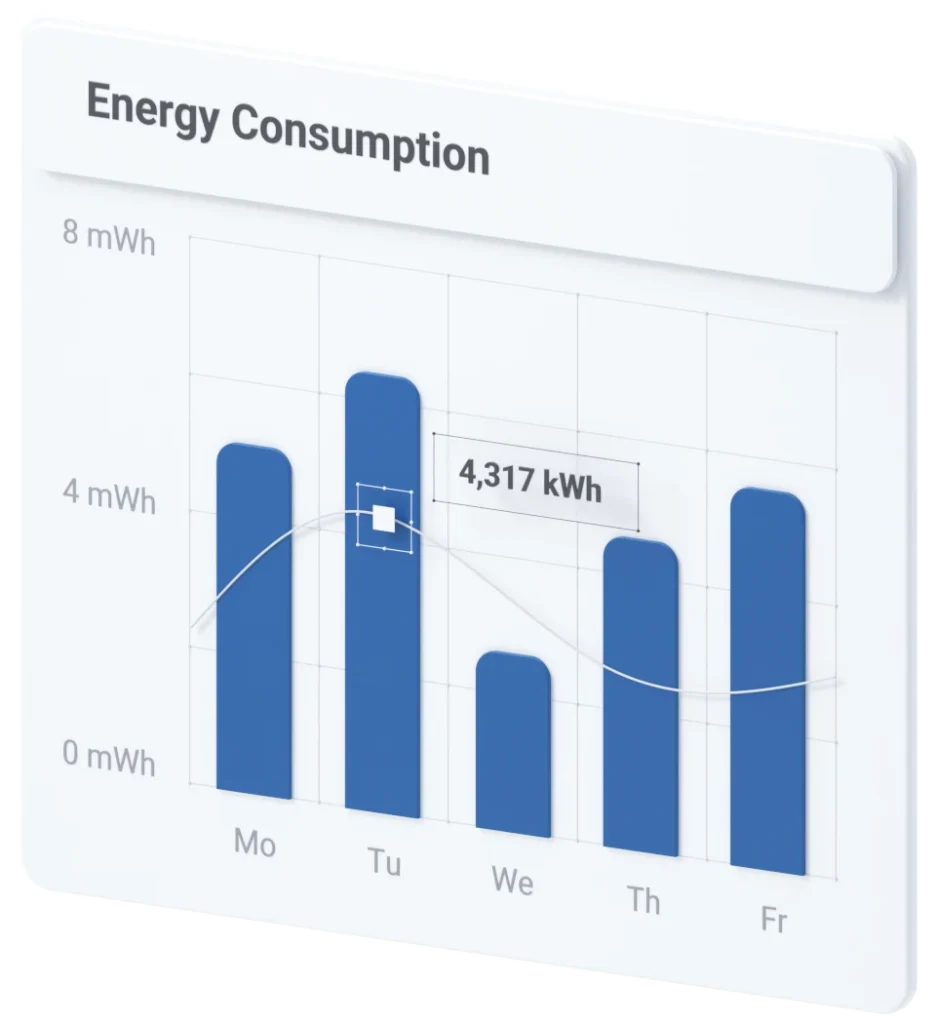
AI-Powered Reporting
Four Segments
Built for Every Role in the Energy Stack
Behind the Meter
Front of the Meter
Utilities
Grid Operators
Behind the Meter
Commercial and Industrial Operations
Controlling what they spend. Avoiding what they are charged. Proving their energy strategy is working.
The data is there. The window to act is short. EDI closes the gap automatically, no dashboards, no manual calls.
Primary Buyers
-
Energy Managers
-
VP Operations
-
CFO
-
Director of Operations
Automate
The events that cost you money now happen automatically
Demand charges can represent up to 50% of a commercial electricity bill. The problem is not that operators do not know peak periods are coming. The problem is that every step between the signal and the response runs through a human being. EDI removes that bottleneck. When a coincident peak probability crosses your threshold, EDI fires. Your operations team gets the alert. The curtailment log updates. The baseline comparison runs. All of it happens in seconds.
Energy-Native Triggers
Responds immediately to peak probability crossings and DR activations.
Automated Notifications:
Simultaneous delivery via email, SMS, and voice to your operations team.
Baseline Calculator
Compares live consumption against your program baseline in real time.
Cost Engine
Applies your rate schedule to consumption data and outputs real cost figures.
DR Event Auto-Response Template
Pre-built and deployable in under 30 minutes.
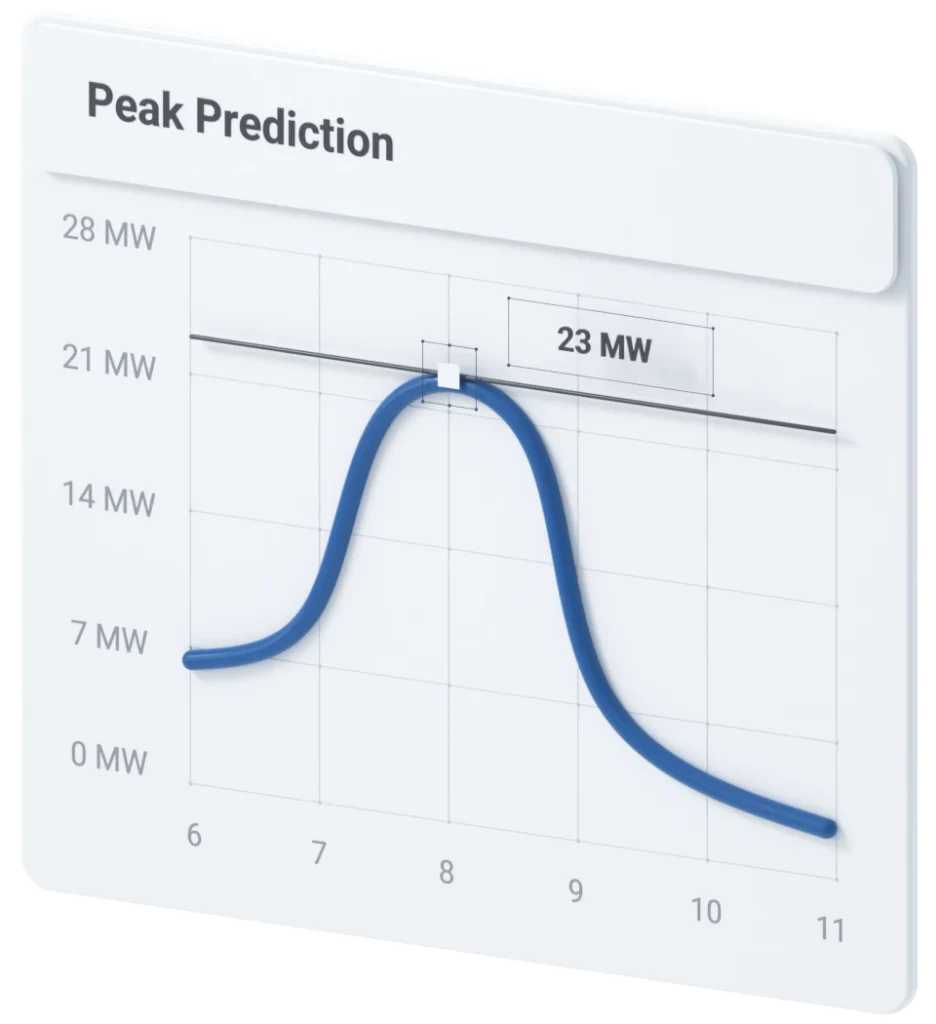
Peak Demand Alert Template
Fires when peak probability crosses your configured threshold.
Save
You stop paying for peaks you could have avoided
Coincident Peak Node
Schedule Trigger
Runs time-sensitive workflows on a precise cadence so coverage does not depend on anyone being at their desk.
Multi-Site Workflow Portability
Export and import workflows across your entire portfolio.
Simulate Before Deploy
Pre-built and deployable in under 30 minutes.
Report
The reporting your leadership team needs writes itself
AI Report Module
Weekly Energy Summary Template
Daily Energy Report Template
Compares live consumption against your program baseline in real time.
dataTrack™-Baseline Module
Calculates production-normalized energy intensity automatically for ESG documentation.
Graph and Table Report Nodes
EDI Dashboard
Front of the Meter
DER Developers, Asset Aggregators, ESCOs
Revenue maximization. Program compliance. Fleet-level performance. The penalty for underperformance is both financial and contractual.
Every missed dispatch means loss revenue you were set to earn. EDI makes sure your portfolio responds as a system, not a chain of phone calls.
Primary Buyers
-
Director/VP of Project Development
-
Head of Energy Markets
-
VP of Engineering and Operations
-
Director of Distributed Energy Resources
Respond
Your portfolio responds to market signals without manual coordination
When a dispatch signal fires, the response chain for most FTM operators still runs through people. Someone gets a notification, someone else makes a call, and another person on site takes an action. By the time the chain completes, the window has narrowed or closed. EDI collapses that chain. Dispatch signals connect directly to automated workflows. The right asset gets the right instruction. The event is logged, the baseline is calculated, and the team is notified, all before anyone has picked up the phone.
Energy-Native Dispatch Triggers
Multi-Site Workflow Deployment
Export and import workflows across your entire enrolled portfolio. One build, consistent response across every asset.
Baseline Calculator
Auditable Event Logging
Simultaneous Notification Delivery
Operations contacts at every enrolled site receive the dispatch instruction simultaneously via email, SMS, or voice.
Comply
Compliance documentation is generated as the event happens, not assembled after
Auditable Event Log
Baseline Calculator
Automated Compliance Documentation
No Manual Steps in the Response Chain
Report
Client reporting that scales with your portfolio, not with your headcount
Workflow Library
EDI Dashboard
AI Report Module
Graph and Table Report Nodes
Utilities
Grid-Connected Asset Program Operators
Primary Buyers
-
Director of Grid Operations
-
VP of Engineering
-
Director of DER Integration
-
Head of Distribution
Visibility
Real-time visibility across your DER network without custom integration
Most utilities with DERs on their network are working with a patchwork of data sources, manual check-ins, and reporting delays. By the time a performance issue surfaces, the window to address it proactively has already closed. EDI connects to enrolled asset data in real time. You can see consumption, performance versus the baseline, and any deviation from expected behavior in real-time. There is no custom integration project required. Enrolled assets connect through the Edgecom platform from day one.
Edgecom IoT Data Source
DR Activation Status Node
EDI Dashboard
Threshold Deviation Alerts
Coordinate
Coordinated asset response without manual dispatch chains
Simultaneous Multi-Recipient Notification
Baseline Calculator
DR Event Auto-Response Template
Automated Compliance Documentation
Report
Program performance reporting that does not require manual data assembly
Scheduled Reporting Workflows
AI Report Module
Graph and Table Report Nodes
Portfolio-Level Dashboard
Grid Operators
Demand Response Program Administrators
System reliability during stress events. Reliable capacity from enrolled demand response resources. Proving that demand flexibility programs keep their promises is key.
Enrolled capacity is only important if it’s available when needed. EDI automates the response chain so your program delivers what it promises, every time.
Primary Buyers
-
Director of System Operations
-
Manager of Demand Response Programs
-
Head of Market Operations
-
VP of Grid Reliability
Activate
Enrolled participants respond faster and more consistently
Demand Response Trigger
Simultaneous Site Notification
Automated Baseline Comparison
Auditable Event Log:
No Manual Steps in the Response Chain
Document
Program performance is documented automatically, not assembled after the fact
Real-time Event Logging
Baseline Calculator
Portfolio Performance Dashboard
Scheduled Administrator Reporting
Scale
Expanding enrollment does not expand your administrative burden
Workflow Export and Import
Template Library
Scheduler-Driven Reporting at Scale
AI Portfolio Summary
How It Works
Connect. Build. Deploy. In Three Steps.
1
Connect Your Triggers
2
Build Your Workflow
3
Deploy and Walk Away
FAQ
EDI FAQ
No. EDI’s Visual Workflow Builder is a drag-and-drop canvas. You connect nodes representing triggers, data sources, calculations, and outputs without writing a single line of code. Most customers get their first workflow live using a pre-built template in under 30 minutes.
EDI connects natively to Edgecom’s IoT sensors across your facility, pTrack’s coincident peak probability engine, grid operator Demand Response event signals, and custom schedule triggers. There is no middleware layer or custom API configuration required.
No. EDI is built for four distinct audiences: behind-the-meter commercial and industrial operators, front-of-the-meter DER developers and aggregators, utilities managing grid-connected asset programs, and grid operators running demand response programs. The platform and workflow logic serve all four.
EDI’s AI Module reads a configured window of your IoT sensor data and generates a structured plain-English report covering consumption trends, top consumers, notable deviations, week-over-week comparisons, and a forward-looking note. Set the schedule once and reports arrive automatically in your inbox or on the EDI Dashboard.
Yes. EDI includes a Simulate Before Deploy mode where all outputs stay local during the simulation. No accidental alerts. No live data affected. The Test Console and Debug Panel show the exact input and output at every node so you know exactly what will happen before you commit.
Yes. Workflows can be exported and imported across your entire portfolio. Build the logic once and deploy it consistently to every site. This is particularly valuable for FTM operators, aggregators, and grid program administrators managing large numbers of enrolled participants.