Last year was a wake-up call for a lot of facility managers across the PJM footprint. Curtailment dispatch hours didn’t just tick up slightly — they surged to record levels. For facilities enrolled in Demand Response (DR), Capacity Performance (CP), or actively curtailing load to manage their PJM 5 Coincident Peaks (CP5), those hours represent real financial exposure — in both directions. Get it right, and you’re earning curtailment payments, avoiding non-performance penalties, and keeping your capacity tag in check. Get it wrong, and you’re leaving thousands of dollars unclaimed while potentially triggering charges that erode your program value entirely.
The difference between those two outcomes almost always comes down to one thing: whether your facility energy monitoring was in place before the event fired — and whether it showed you exactly what was happening in real time.
Why DR and CP Programs Are More Demanding Than Ever
PJM’s Capacity Performance rules were designed to create accountability. Unlike older DR structures, CP penalties for non-performance during a dispatch event can be steep — and they scale with how far your facility misses its committed curtailment baseline. This means showing up to an event without a clear picture of your real-time consumption isn’t just operationally sloppy. It’s financially risky.
Add to that the fact that curtailment signals can fire during some of the most operationally complex moments — peak summer heat, high production periods, or times when your load mix is anything but predictable — and you start to see why guessing doesn’t cut it. You need to know, right now, what each asset is drawing, what your facility total looks like, and whether your curtailment strategy is actually working as the event unfolds.
“A curtailment event isn’t the time to start pulling data together. By then, it’s too late. The visibility has to already be there.”
The CP5 Stakes: Five Hours That Define Your Capacity Tag for the Year
Layered on top of DR and CP obligations is one of the highest-stakes curtailment challenges in the PJM market: the 5 Coincident Peaks. Each year, PJM records the five highest demand hours across the entire grid — typically on sweltering summer afternoons when the system is under maximum stress. Your facility’s consumption during those five specific hours determines your capacity tag for the following year, which directly drives your capacity cost obligations.
Miss even one of those peaks — meaning your facility was running at full load when PJM hit a system peak — and your capacity tag climbs. Over a multi-year horizon, that can translate into tens or hundreds of thousands of dollars in avoidable costs, depending on your facility’s size. And unlike a curtailment dispatch event where you get a signal ahead of time, CP5 peaks are only confirmed after the fact. You can’t wait for certainty. You have to be ready to curtail aggressively on days that look like they could be peaks — and you need your monitoring data to tell you whether your curtailment is actually landing.
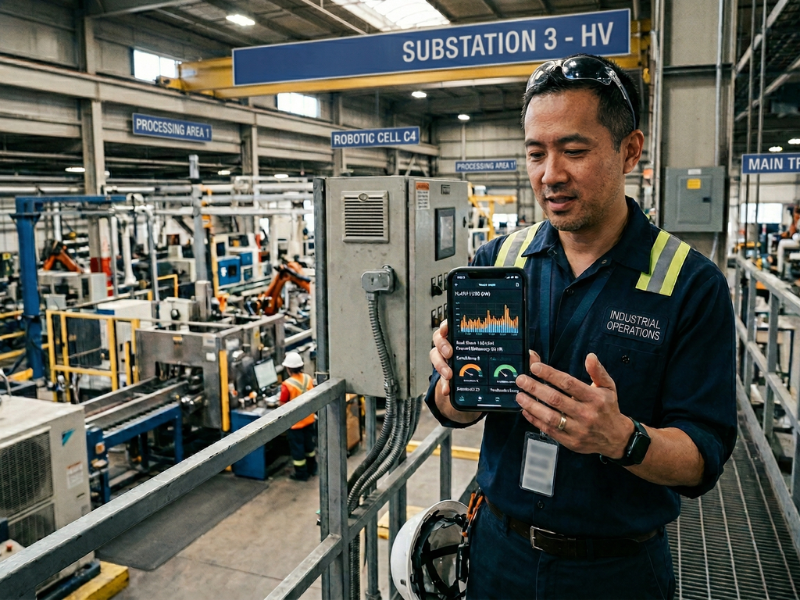
This is where real-time facility energy monitoring becomes indispensable for CP5 strategy. On a high-risk peak day, knowing your facility’s consumption at the interval level — right now, not 30 minutes from now — is what lets you make the call with confidence. If your loads aren’t responding the way you expected, you see it immediately and can adjust. Without that visibility, you’re relying on assumptions that could cost you on the one day it matters most.
Facility Energy Monitoring Isn’t a Nice-to-Have — It’s the Foundation
There’s a common misconception in how facilities approach DR program enrollment. Many organizations focus heavily on the strategy, which loads to curtail, what their baseline should look like, how to sequence shutdowns — but they underinvest in the layer underneath all of that: knowing, in real time, whether the strategy is executing correctly.
Think of it this way. You can have the best curtailment playbook in the world, but if you’re relying on data that’s 15 or 30 minutes old, or if you’re stitching together information from multiple disconnected systems, you’re effectively operating blind during the most critical window. Real-time interval meter data and real-time asset-level visibility aren’t just convenient — they’re the prerequisite to everything else working.
This is especially true when you’re managing multiple facilities. What looks like a straightforward portfolio-level curtailment commitment gets complicated quickly when each site has its own load profile, its own baseline, and its own operational constraints. Without a single dashboard pulling it all together in real time, your team is making decisions based on fragments.
What “Real-Time” Actually Means in Practice
Real-time monitoring in the context of DR and CP programs means more than just having a live meter feed. It means having granular interval data at the asset level, so you can see not just what the whole facility is consuming, but which specific systems are driving that consumption. It means being able to verify, mid-event, that the loads you intended to curtail are actually offline — and by how much. And it means having all of that visible across every facility in your portfolio, in one place, without toggling between systems or waiting on manual reports.
It also means being able to connect that operational data to your utility billing — so that when an event wraps up, you can reconcile what actually happened against what was measured and billed. Utility bill analysis alongside real-time data isn’t just good housekeeping. It’s how you catch discrepancies, verify curtailment credits, and make sure no performance is going unrecognized.
Everything your facility needs to perform when it counts
- Real-time interval meter data with granular load visibility
- Real-time asset-level monitoring across your equipment
- All facilities on a single, unified dashboard
- Utility bill analysis to reconcile and verify performance
- Interval-level consumption data critical for CP5 peak day curtailment
The Cost of Flying Blind
Consider what happens during a 2-hour curtailment dispatch without real-time visibility. Your team executes the pre-planned shutdown sequence. You assume things are running to plan. The event ends. A week later, your billing data comes in and reveals that one of your larger HVAC units never actually cycled down — a controls fault that nobody caught because nobody could see it in the moment. That gap in your curtailment could mean a non-performance charge, a reduced curtailment payment, or both.
With a record number of dispatch hours on the table last year, multiply that kind of scenario across even a fraction of those events, and you’re looking at a meaningful hit — both to the DR revenue you were counting on and to your standing in the program.
Real-time monitoring doesn’t just protect you from those moments. It gives your team the confidence to act decisively during an event, because you’re not guessing — you’re watching it happen.
Building the Right Foundation Before You Optimize
If your facility is enrolled in a DR or CP program — or you’re considering enrollment — the conversation about optimization, baseline accuracy, and strategy has to start with a conversation about visibility. Tools that help you forecast peaks and optimize your curtailment performance are genuinely valuable, but they compound on top of a monitoring foundation. Without that foundation, you’re optimizing in the dark.
Getting your real-time data infrastructure in place first isn’t just good practice. It’s what separates facilities that consistently perform during dispatch events from those that consistently leave money on the table — or worse, accumulate penalties that undermine the whole point of program participation.
The facilities that performed best last year — through one of the heaviest curtailment seasons in recent memory — weren’t the ones with the most aggressive curtailment strategies. They were the ones who could see exactly what was happening at every moment, and act on it.
Note: Accuracy in peak demand forecasting (5CP peak prediction) is handled through our pTrack® platform, which works in concert with dataTrack™ real-time monitoring capabilities. Together, they give facilities a complete picture — from the moment-to-moment data during an event or peak day to the predictive intelligence that shapes your strategy heading into one.
Ready to See Your Facility in Real Time?
Talk to our team about how dataTrack™ can give you the visibility you need to perform and get paid during every dispatch event. Contact Our Team.