
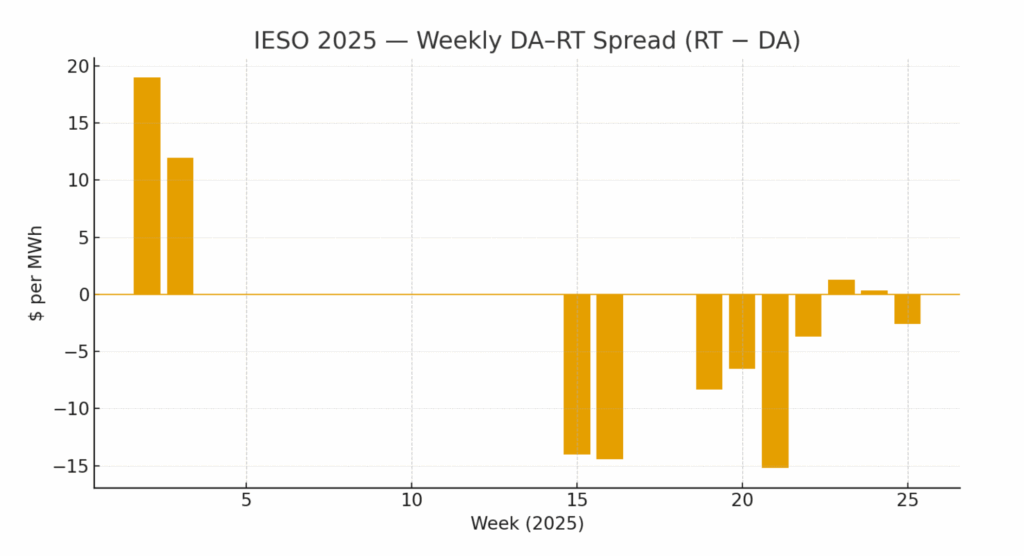
Since its go-live, the day-ahead (DA) market under Locational Marginal Pricing Ontario has become the system’s center of gravity. Prices are steadier because participants take risk one day in advance and encode expectations—load, renewable output, outages, and network limits—directly into their bids. Real-time (RT), by contrast, acts as the truth serum: it absorbs the last-minute surprises (weather misses, unit trips, export swings, ramp constraints, constraint flips) and prices them with no buffer. Although weekly DA and RT averages often converge, a small set of intra-week hours still drives disproportionate profits and losses. The operational takeaway is simple: make your base-exposure decisions in DA, and manage the tails deliberately in RT.
The 2025 Tape: May to October Under Locational Marginal Pricing Ontario
May: New rules, new muscle memory
The shift to locational marginal pricing (LMP) put energy, congestion, and losses into a single nodal figure, making geography matter in a way Ontario hasn’t lived with before. A financially binding DA schedule introduced settlement consequences for deviations, while ERUC in pre-dispatch offered better commitment visibility without eliminating uncertainty. Early on, RT moved more than DA because participants were still calibrating their offer curves and renewable shapes, while hedges such as CfDs and forwards effectively anchored DA revenue expectations. Volatility in those weeks wasn’t a design failure; it was the market learning its new instruments.
Late June: Heat turns small misses into big spreads
When summer hit, even a modest forecast undercall, say 1.5 GW at peak, pushed the stack toward more expensive marginal units immediately. Tight ramp windows, hydro and thermal ramp-rate limits, and intertie constraints reduced flexibility just as surprise demand arrived. Cloud cover and wind lulls often compounded the squeeze. DA looked calmer because those bids already embedded a heat premium; RT priced the surprise component hour by hour. On hot days, the hour-ahead deltas mattered far more than the best-laid day-ahead plan.
Late August: Shoulder season compresses spreads
As temperatures drifted toward comfort range, load flattened, and steep ramps eased. Maintenance windows became more predictable, and operating-reserve (OR) prices generally softened. Spreads compressed, and that quiet created a useful window to reset hedge books, evaluate strategy drift, and benchmark DA-RT variance before winter returned with sharper gradients.
October: Convergence in the middle, action at the edges
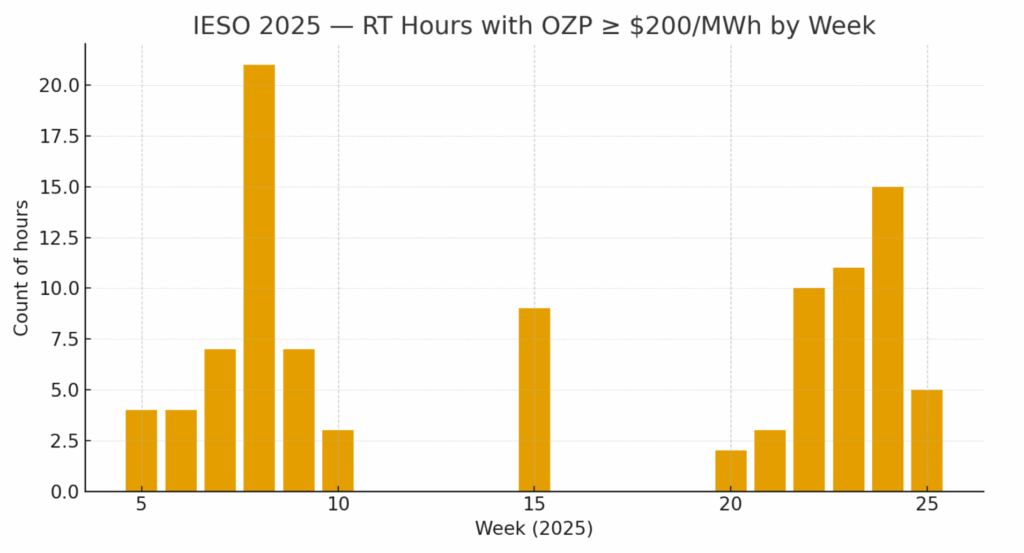
By autumn, DA and RT weekly averages lined up well (for example, DA around $56.98/MWh and RT around $57.34/MWh across Weeks 23–24), a sign of improving forecasts and alignment. Yet the edges still mattered. Evening ramps—solar fade combined with rising load and wind uncertainty—continued to generate a handful of “expensive” hours each month. Those hours dominated risk and returns; weekly means, while comforting, told only half the story.
Why DA–RT Spreads Breathe
Forecast Error Meets Physics in Ontario’s LMP Environment
DA sees the world in bulk; RT must honor timing. A 1–2 GW surprise during a tight two-to-three-hour ramp is costlier than the same miss at 2 a.m. The right workflow is to track net-load error at the five-minute level, rank hours by the product of that error and an effective scarcity score (available fast-start MW, intertie headroom), and expect the top-ranked intervals to explain a disproportionate share of price spikes.
Operating Reserve as a leading indicator
OR scarcity is episodic, not structural, but when it bites, it pushes energy prices higher to preserve headroom. A run-up in OR prices in the preceding intervals is often the canary for RT energy spikes in the same ramp window. Watching that tape in real time is worth as much as another decimal place in your day-ahead forecast.
Congestion turns geography into destiny
Nodes and zones no longer move as a single orchestra. The Northwest can swing with local outages, hydro constraints, and export behavior, with extreme LMPs in both directions. Ottawa/East occasionally decouples during transmission limits, and the West flips sign depending on flows and outages. Basis risk—your node or zone versus the Ontario Zonal Price (OZP)—now matters as much as outright price level.
Playbooks by Participant
Merchants and Renewables
Treat DA as the place to lock the shape you can stand behind. Use production-weighted offers based on P50/P75 profiles rather than nameplate, and encode availability risks—icing, curtailment, wind shear—directly as price adders. In RT, work from predefined shaping thresholds: if the RT discount to your DA schedule breaches a level, reduce output or adjust according to a matrix that accounts for hour, basis, and imbalance fees. Hedging should match shape, not just volume; where the basis is lively, consider zonal or nodal overlays.
Storage (BESS)
Offer firm discharge in DA during hours with the highest expected spreads to satisfy lenders and lock base margin. In RT, protect evening ramps with SOC floors so you’re never empty when it counts. A two-trigger policy—price-spread threshold plus an OR or net-load-error stress signal—keeps dispatch disciplined. Optimize against a clear objective: energy spread plus any OR carry minus degradation, under SOC and ramp constraints. Don’t waste cycles on $20/MWh pops if saving them nets $200/MWh windows.
HDR and Demand Response providers
Design events around human systems. Short, staggered sheds prevent participation fatigue and keep operations sane. Pre-cool or pre-heat to shift energy out of spike hours. Baselines must be defensible; sloppy savings today erode credibility tomorrow. Segment sites by response latency and deploy the fastest first into the sharpest ramps.
LDCs and Large C&I
Procure base exposure in DA on predictable days and keep RT or caps for the tails—heat events and surprise ramps. Indexed pass-through with triggers can preserve price signals while reducing bill shock. Operationally, tighten hour-ahead forecasts with ensemble weather and short-term renewable models, and codify event playbooks so that crossing a threshold in net-load error or OR automatically toggles plant schedules or demand.
Tactics That Travel
Start with a composite ramp score that multiplies forecast net-load delta, available fast MW share, and a renewables-uncertainty index. Feed that score into DA bid adders, RT discharge triggers, and DR scheduling. Put an OR “heatline” on the ops dashboard; if OR stays elevated across several intervals inside the evening ramp, lift BESS SOC floors and pre-arm DR. Maintain a constraints watchlist—element names, TTC limits, loadings, expected relief dates—and attribute P&L by constraint ID. Over time you’ll learn which bottlenecks actually move your book. DA stabilizes the week; RT writes the headlines on extreme days. Forecast misses drive the gaps, especially when they collide with ramp limits and scarcity pricing. Shoulder seasons compress spreads and are the right time to recalibrate models and hedges. By October, averages converged, but tails persisted, and those 10–20 high-impact hours dominated returns. In those tails, congestion rules—so zone-level thinking beats province-wide generalities for both hedging and operations.
Glossary
LMP (Locational Marginal Price): The cost of serving the next MW at a node, including energy, congestion, and losses—hence why location now directly shapes outcomes.
OZP (Ontario Zonal Price): A province-level aggregate useful for summaries, but it can obscure volatile nodal or zonal moves.
ERUC (Enhanced Reliability Unit Commitment): A pre-dispatch process that improves commitment foresight without eliminating surprises.
Shoulder season: Spring/fall periods with milder loads and gentler ramps; spreads typically compress and mean-reversion dominates.
FAQs
Q: If DA and RT averages converge, why do I still lose some weeks?
A: Because P&L is skewed to a handful of high-impact hours. Missing ramps or mismanaging SOC hurts more than a tidy weekly mean helps.
Q: Is OR a tradable hedge for energy volatility?
A: Not universally. But monitoring OR materially improves bidding and dispatch timing, especially during evening ramps.
Q: How much basis should I hedge?
A: Start with a materiality study. Simulate P&L with and without basis overlays across eight to twelve recent weeks and hedge only what moves the needle.
Take control of your electricity costs with the Day-Ahead Market.
Edgecom will assess your facility, evaluate your on-site assets, quantify your PRL potential, and deliver a tailored case study with clear next steps. If you qualify, we’ll guide you through every stage of PRL registration and participation. Start optimizing your facility’s energy strategy today.